Imagine this: you’re running a high-stakes digital marketing campaign. Your ads are performing well, traffic is flowing in, but something just isn’t clicking. Visitors land on your page, only to leave seconds later. Leads are trickling in, and costs keep climbing. That’s exactly where our client we found ourselves—a promising campaign held back by underperforming landing pages.
With sky-high bounce rates, slow mobile performance, and escalating costs per acquisition (CPA), it was time to take action. Through targeted landing page optimization, we turned the tide, cutting costs and unlocking a flood of leads. Here’s how we made it happen.
Challenges
The primary challenges were rooted in the inefficiencies of the existing landing pages. We had to identify the bottlenecks. These included:
- High bounce rates: The landing pages suffered from a 70% of visitors bouncing off, resulting in missed conversion opportunities.
- Slow page load times: With an average load time of 5.8 seconds, users, especially on mobile, often abandoned the page before it fully loaded.
- Mobile performance deficiency: Despite mobile comprising 80% of the market, the campaign was losing ground to competitors in generating leads and clicks on mobile devices.
High CPA: The cost to generate leads was unsustainable, especially as campaign impressions continued to grow.
The goal was simple yet ambitious: cut costs, increase leads, and make the landing pages as irresistible as the campaigns driving traffic to them.
Actions Taken
When we set out to optimize the landing pages, we knew that speed was the foundation of a great user experience. Our first mission? Address the sluggish 5.8-second load times that were driving users away. This wasn’t just about small tweaks—it was a complete transformation, grounded in strategic technical and design decisions. Here’s how we approached the challenge.
Automatic Image Compression & Resizing
- Landing Page Builder Integration: We implemented a feature that automatically compresses images upon upload, resizing them to optimal dimensions for the page. This greatly reduced overall file size without sacrificing noticeable quality.
- Why It Matters: A single large image could significantly slow down the page. By compressing and resizing during the upload process, every image is optimized from the start.
Manual Compression Guidelines
- Team-Wide Approach: We advised designers and content editors to manually compress and resize images before uploading as an interim solution.
- Batch Optimization: Especially for large batches of existing images, this manual step helped ensure that files were trimmed to manageable sizes right away.
Ongoing Monitoring & Review
- Metric Tracking: We closely watched key performance metrics—namely First Contentful Paint (FCP), Largest Contentful Paint (LCP), and Speed Index—to see how changes affected load times.
- Periodic Check-Ins: Even after implementing automatic compression, we regularly audited new images and other assets to ensure they remained optimized.
Results
These efforts immediately brought down load times to an impressive 2.4 seconds, improving user experience and engagement.
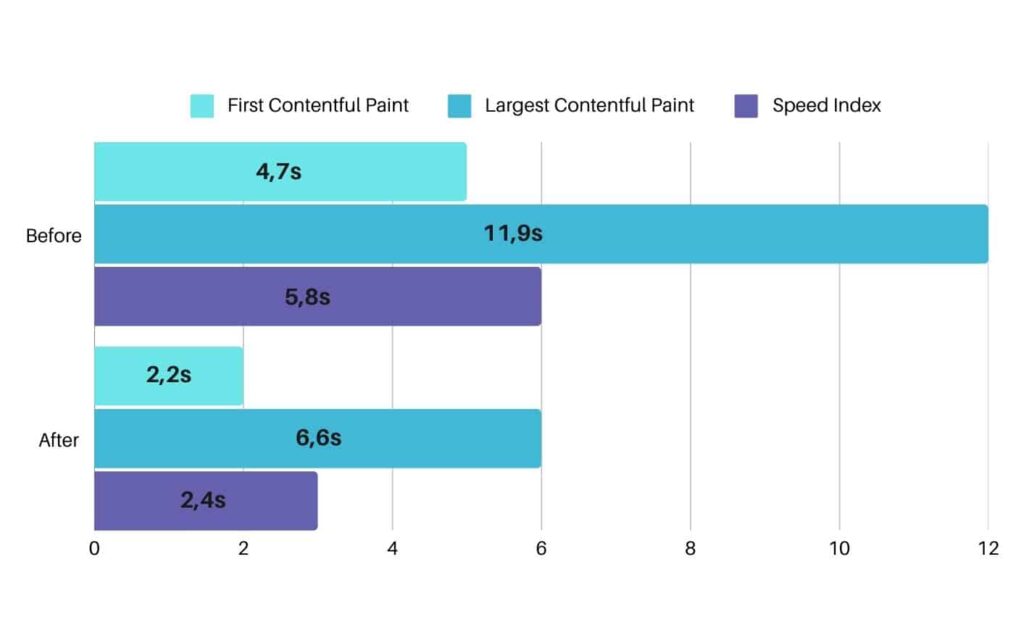
First Contentful Paint (FCP)
- Before: 4.7 seconds
- After: 2.2 seconds
- What It Means: This is how quickly a user sees the first piece of content—text, image, or any other element—on the page. Halving this time drastically improves the user’s perception of speed.
Largest Contentful Paint (LCP)
- Before: 11.9 seconds
- After: 6.6 seconds
- What It Means: The LCP metric measures when the main content (often a hero image or large headline) is fully loaded. A lower LCP indicates users see the page’s core content much sooner.
Speed Index
- Before: 5.8 seconds
- After: 2.4 seconds
- What It Means: The Speed Index reflects how quickly the visible parts of the page are rendered. A lower number means the majority of the page’s elements appear faster, leading to a smoother browsing experience.
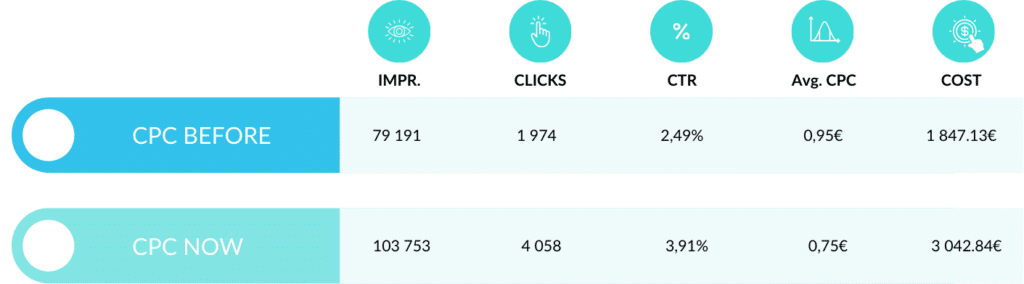
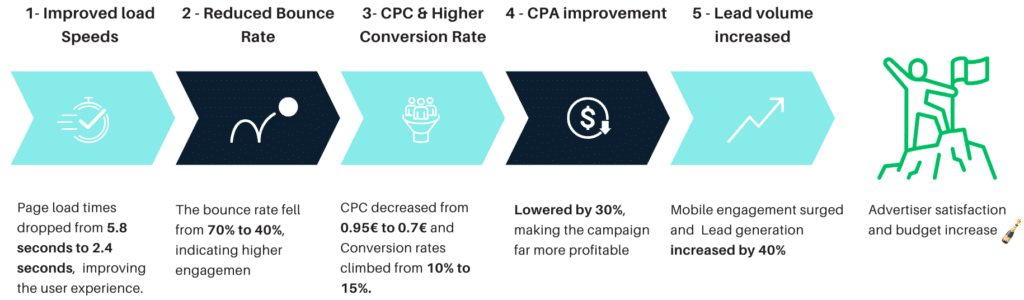
In addition, the landing page optimization led to significant cost savings, dropping CPC from 0.9€ to 0.75€, while boosting lead generation by 40% and lowering CPA by 30%. Page load times improved from 5.8 seconds to 2.4 seconds, reducing bounce rates from 70% to 40% and driving conversion rates up from 10% to 15%. Coupled with an 80% mobile market focus, the campaign achieved both stronger engagement and more profitable returns.
Conclusion
Every campaign has untapped potential waiting to be unlocked. This journey shows how taking control of the tools at our disposal can create real impact. By addressing key pain points, we unlocked significant improvements in cost efficiency, lead generation, and user experience.
What’s even more exciting is that this is just the beginning. There are still countless opportunities for optimization, and we’re committed to tackling them one by one, ensuring every campaign reaches its full potential.
We continuously optimize our own landing pages to generate high-quality leads at a lower cost—Contact us to see how we can push your lead generation efforts to the next level!
